
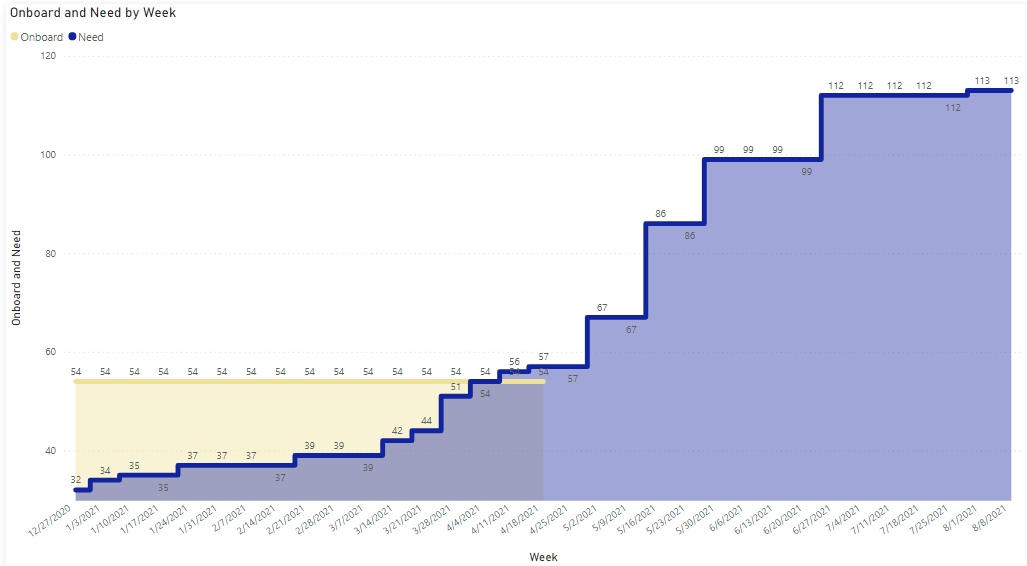
Request was to show a Running Total of Job Vacancies and Filled Vacancies by Target Date.
First, I created a Calendar table: Calendar = CALENDAR(DATE(2021,1,1),DATE(2021,12,31))
Second, I had to create a Running Total of Job Vacancies from Jan 1st thru the Target Date.
CountTotalRunning = CALCULATE(
COUNTA(‘Vacancies'[ID]),
FILTER(
ALLSELECTED(‘Vacancies’),
‘Vacancies'[Need By Date] <=MAX(‘Calendar'[Date])
)
)
Next, I had to create a Running Total of Job Vacancies that have been Filled to-date. The stumper was getting the Filled line to stop at Today’s date.
CountTotalOnboardToday = VAR x = CALCULATE(
COUNTA(‘Vacancies'[ID]),
FILTER(
ALLSELECTED(‘Vacancies’),
‘Vacancies'[Status] = “Filled”
)
)
RETURN
IF (MAX(‘Calendar'[Date]) > TODAY(),
BLANK(), x
)