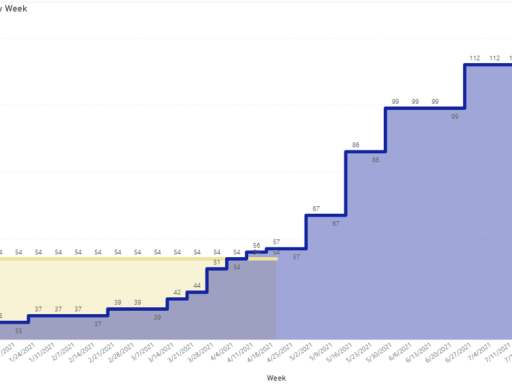
Request was to show a Running Total of Job Vacancies and Filled Vacancies by Target Date. First, I created a Calendar table: Calendar = CALENDAR(DATE(2021,1,1),DATE(2021,12,31))Second, I had to create a Running Total of Job Vacancies from Jan 1st thru the Target Date. CountTotalRunning = CALCULATE( COUNTA(‘Vacancies'[ID]), FILTER( ALLSELECTED(‘Vacancies’), ‘Vacancies'[Need By Date] <=MAX(‘Calendar'[Date]) )) […]
Power BI: Plan vs Actual Line Charts